Using Network Monitor to understand your website performance

This post is part of a series of posts on improving the performance of your website and understanding what is going on with your web pages.
There are a lot of reasons your website might be running slow and if you start looking into it with the wrong information you can go down a very long road with out making a difference.
To get the right information to start looking into it you need to start profiling your website.
Profiling allows you to get a picture and idea as to what is going on when someone opens your webpage.
Network Monitor
You don't need to buy something or use other web apps your browser has tools built in to get you started and give you a good idea what is happening.
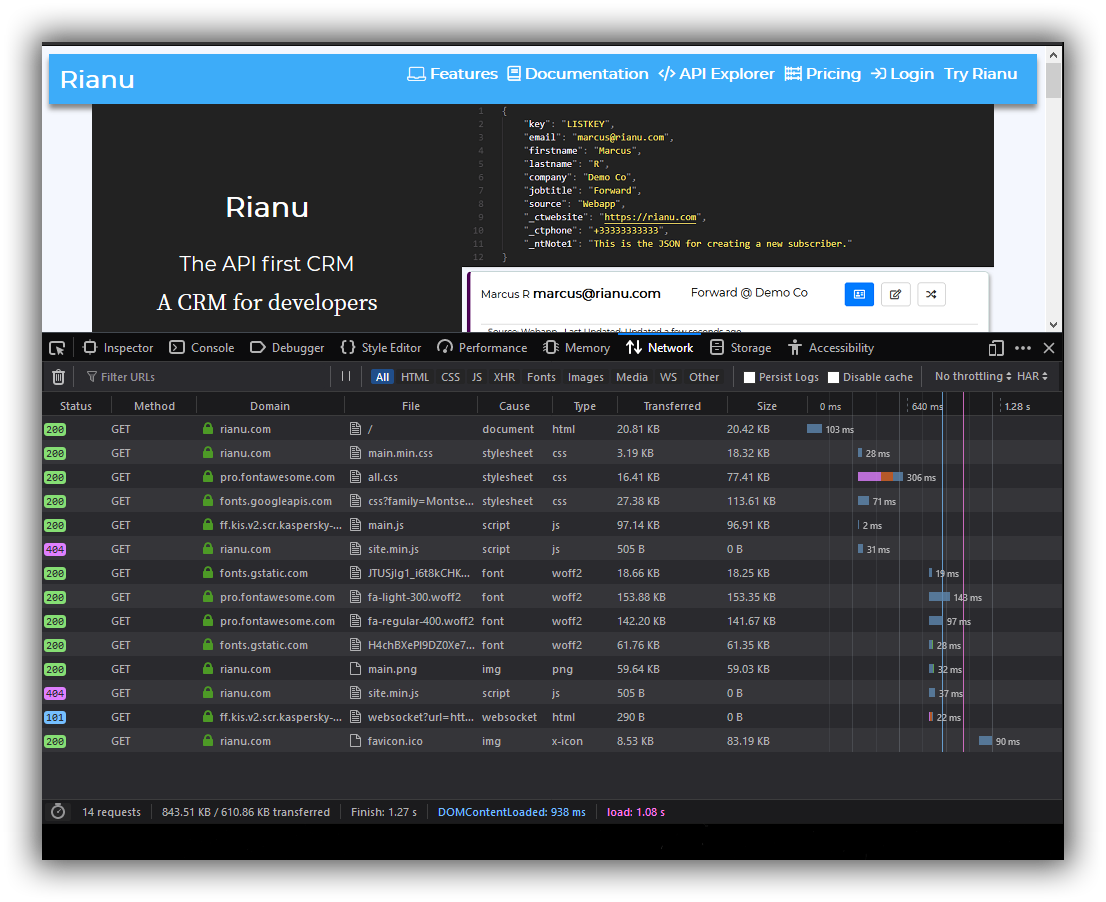
I use Firefox Developer edition. Open your browser and the website and right click anywhere and select "Inspect Element" and select the "Network" tab or use "ctrl shift E" this will open onto the "Network" tab.
It will be empty by default in Firefox go ahead and reload your website and you will see the different network requests being listed in the order as they are executed.
At the very bottom you will see a summary once your page is loaded.

The summary will show you the number of requests but more importantly the "Finish" and "Load" time.
Finish: This is the time from opening the webpage to fully showing the page and loading all the information.
Load: This is the amount if time while loading information from other resources.
How a Webpage Loads
A webpage loading is a very simple top down loading. Everything is executed in sequence from the top of the page to the bottom.
The next thing cannot load until the item before it loads.
I know that HTTP / 2 will change this but I will cover that in a new post how to use HTTP/2 to improve performance.
Most websites will load in a waterfall style. That's where network monitor comes in.
Understanding Network Monitor
This shows the different calls that are executed by your webpage to load and render data.
Calls to load you fonts, CSS, Javascript, etc.
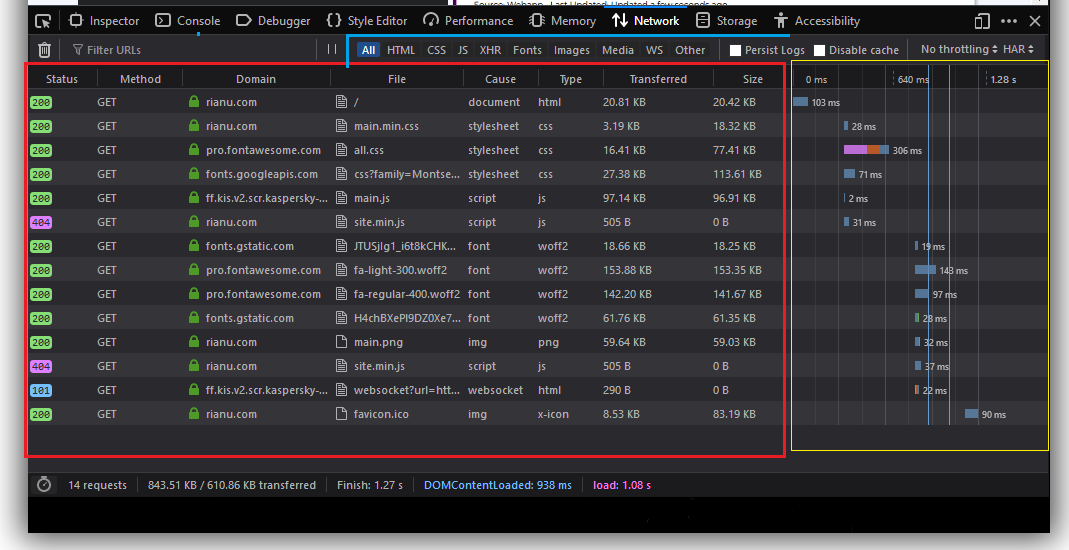
First up at the top (blue lines) we have the "All" selected, this allows us to filter the network monitor to different types of resources to see what is happening with just those.
On the left (in red box) we have the calls that are being made on load. You can see I'm loading main.min.css from rianu.com or I'm loading all.css from fontawesome.
Here we also see the
- Cause - Document / Stylesheet / script / img etc
- Type - HTML / CSS / JS / PNG / JPG
- Size - This is the size of the file.
On the right you see the chart it shows how long visually it took to load the resource you can also see that the next set of resources load once the above are finished. In my case above I have fonts that can't load until the fonts are downloaded. This all happens in milliseconds but it can take longer.
Just above our chart you can see an option "No Throttling" this allows your browser to change the speed it uses to load the page so you can do some testing from mobile network speeds and see how the site performs.
Summary
Once you run this tool on a site that is running slow you can get a very clear picture of what might wrong or going on you can very quickly and visually see what is slow or big.
With the size we can see if it's a big file.
Images might need to be optimized.
CSS might need to be minified.
JS might need to be minified.
Remove and take out calls that are not in use.
I'll be covering the each of these options in more detail as I work on this series. We'll also look at the performance profil tool in firefox and other tools you can use to get into the real detail of your websites performance.